For FP&A & Finance & Operations Analyst Roles· Project-Based · 5 Levels

Master Excel
for FP&A, MIS &
Finance Analyst Roles

Learn how FP&A Analysts use Excel for Analysis & Automation
5 Levels
Excel Basics
Finance Projects
Dashboards
Power Query
Automation
⏳ Special offer price ends July 10. Price increases to ₹1,499 after.

Your Finance Career Growth is Stuck
Because of One or More of These Problems

Many finance and accounting professionals work hard every day — but still struggle to move into high-paying analyst and reporting roles.

Manual Reporting
You spend hours building reports that can be automated in minutes.
🔁
Routine Work
Same reports. Same reconciliation. No exposure to automation or advanced analysis.
😟
Low Confidence
You know Excel basics but struggle with advanced problem-solving and reporting.
📄
Weak Resume
No strong reporting or automation projects to stand out in interviews.
⚠️
Last-Minute Stress
Broken formulas, VLOOKUP errors and Excel crashes during deadlines.
🧭
No Clear Guidance
No mentor to help you move into senior reporting and analyst roles.
THE REAL PROBLEM
Generic Excel Courses Teach Formulas.
They Don't Prepare You for FP&A or Senior Reporting Roles.
✔ Real Reporting
✔ Finance Analysis
✔ Automation Projects
If you want to move into high-paying analyst roles, you need more than formulas.

You need to solve real finance reporting, analysis and automation problems.

This course is built specifically for Finance, FP&A and Reporting careers.
WHY THIS COURSE IS DIFFERENT

Not Another Excel Course.
Built for Real Finance Jobs.

Learn Excel through real reporting, automation and FP&A scenarios used in MNC finance teams.

📊

Real MNC Data

Practice using real finance datasets and reporting scenarios.

📁

Real Projects

Build dashboards, MIS reports and automation projects.

🚀

Career Focused

Built for FP&A, Finance Analyst and Reporting roles.

5
Levels
40+
Hours
10+
Projects
200+
Problems
Most Excel courses teach features & formulas.
This course teaches real finance problem-solving.
YOUR TRANSFORMATION

How Your Career Changes After This Program

This program helps you move from routine Excel work to high-value reporting, automation and analyst roles.
Reporting to Insights
Spend less time building reports and more time generating insights.
Scalable Reporting
Work with large datasets and build reports that refresh in one click.
Senior Role Confidence
Understand business needs and build reports leadership values.
Better Career Opportunities
Strengthen your resume with real projects for analyst roles.
Become the Go-To Expert
Be known for solving complex reporting and automation challenges.
Stronger Problem Solving
Build analytical thinking by solving 200+ real-world scenarios.

What you will build

Top Analysts Don’t Spend Hours Building Reports.
They Spend Time Generating Insights.

Routine reporting will increasingly be automated. The future belongs to professionals who can automate data and provide insights for better decisions.

Complex data model built inside Excel — SOBH's Analytics
HOW THE PROGRAM WORKS

Your 5-Level Journey
From Excel Basics to MIS Automation Expert

Learn through 5 structured levels designed to build practical skills for Finance, FP&A and Reporting roles.

01
Excel Foundations
Beginner Friendly

Build strong Excel fundamentals including formatting, filtering and daily reporting workflows.

02
Financial Analysis
Hands-on Projects

Learn practical Excel functions, Pivot Tables and MIS reporting using real project data.

03
Dashboard Building
No-Code Automation

Build secure dashboards with user-level access inside Excel without coding.

04
Finance Analytics
Decision Support

Master revenue, cost, profitability, variance and trend analysis.

05
MIS Automation
Most Powerful

Work with large datasets and automate reports using Excel BI, Power Query and one-click refresh.

Full Curriculum

Detailed Course Content

Click any level to see every topic. Start from any level that matches where you are right now.

Excel Introduction
Excel Basics — Introduction
Excel User Interface
Entering Data into Excel
Raw Data Excel Introduction — Download this
Formatting in Excel
Formatting Rows and Columns
Control & Shift Keys — Important Shortcut Keys
Text Formatting
Formatting Numbers
Formatting Dates
Formatting Others
Working with Data in Excel
Filtering Data in Excel
Sorting Data
Find & Replace
Copy and Paste Data
Paste Special Function
Clean, Transform Group
Text to Column
Flash Fill
Remove Duplicates
Data Validation
Group and Subtotal Data
Consolidate Data
Insert Objects
Formula & Functions Introduction
Functions & Formulas
Final Review & Others
Course Setup
Course Introduction
Before you Start
Guidelines
Project Walk-through
Project Files
Text Functions Challenges
1. Join Text — Create a full name column
2. Proper — Change Name to Proper
3. Combine Functions
4. Trim — Remove Extra Space
5. Right Function — Extract Location ID
6. Left Function — Extract Employee ID
7. Dynamic Extraction Len & Left
8. Flash Fill
Date Function Challenges
1. DATEDIF - DAYS — Calculate Average Days
2. DATEDIF - MONTH — Calculate Months
3. DATEDIF - YEAR — Employees Less than 1 year old
4. Network Days — Calculate Total Working Days
5. YEAR Function — Employees Joined in 2023
6. MONTH — Employees joined in March '23
7. Quarter — Employees Joined in Q1 '23
8. TEXT — Any relieving dates on Sat or Sunday
9. How many people relieved in 2022
10. MONTH — Number of people relieved in Nov '22
11. Quarter — Number of people relieved in Q1 '23
Number Function Challenges
1. Number Functions — Employee Working Days
2. Number Functions — Labour Budget Summary
3. Number Functions — Conveyance Actuals
Lookup Functions Challenges
1. Lookup Function Intro
Problem #1 — Which employee has the highest travel amount
Problem #3 — Reasons for Vlookup Errors & How to fix them
Problem #4 — Replace #NA Error with Text Value Not found
Problem #5 — What is the total Emp Count for Bangalore
Problem #6 — What is the employee count for Manager Jayan Tharakan
Problem #7 — How to use XLOOKUP to populate manager name
Problem #8 — Populate Experience Category
Problem #9 — Populate Employee Level
Problem #10 — Populate Weekday / Weekend based on Day
Problem #11 — How to use Xlookup with Wildcard
Problem #12 — How many people are under Leader Deepesh Jain
Problem #13 — What is the average Fresher Cost Rate
Problem #14 — How to avoid creating a Temporary Lookup column
Problem #15 — How to use Xlookup to populate Cost Rate
Problem #16 — How to use Xlookup with multiple criterias
Problem #17 — What is the Travel cost for Project PID002
Problem #18 — What is the total Labour Plan cost for PID003
Problem #19 — Calculate Monthly Labour Plan Cost
Logical Function Challenges
Logical Functions Introduction
Problem #1 — Categorize Baselocation vs Others
Problem #2 — Category Travel as Approval Required and Not required
Problem #3 — Calculate 2H forecast scenario 1
Problem #4 — Populate Weekend vs Weekday in Travel
Problem #5 — Forecast Scenario 2
Problem #6 — Forecast Scenario 3
Problem #7 — What is the standard vs premium employee count
Problem #8 — 2H Forecast scenario 4
Problem #9 — How many Level 2 approval travel charges are there
Problem #10 — Forecast Scenario 5
Problem #11 — Categorize Conveyance Charges
Problem #12 — Create Experience Categories
Problem #13 — Forecast Scenario 6
Summarize Data — Pivot Tables
Pivot Tables — Setting the Context
Problem #1 — Create a summary showing Employee Count by Location
Problem #2 — What is the Avg. Experience for each role
Problem #3 — What is the average experience by role & project
Problem #4 — Modify the Pivot table to change the design
Problem #5 — What is the count of employees under each leader
Problem #6 — Active vs In-Active employee count under each leader
Problem #7 — What is the premium vs standard employee count by project
Problem #8 — How many people joined in each year by month
Problem #9 — How many people were relieved each year by Quarter
Problem #10 — No. of people joined under each leader by year & Month
Problem #11 — Architect role with highest average cost rate
Problem #12 — Emp Count & Avg. cost rate for Tester & DBA Roles
Problem #13 — Percentage count of employees by location
Problem #14 — Percentage of conveyance spent in 2013
Problem #15 — Other expense total & percentage for 2023
Problem #16 — Other expense 2H '22 vs 1H '23 variance & percentage
Problem #17 — Plan labour variance & percentage variance
Problem #18 — Labour Actual variance & percentage variance
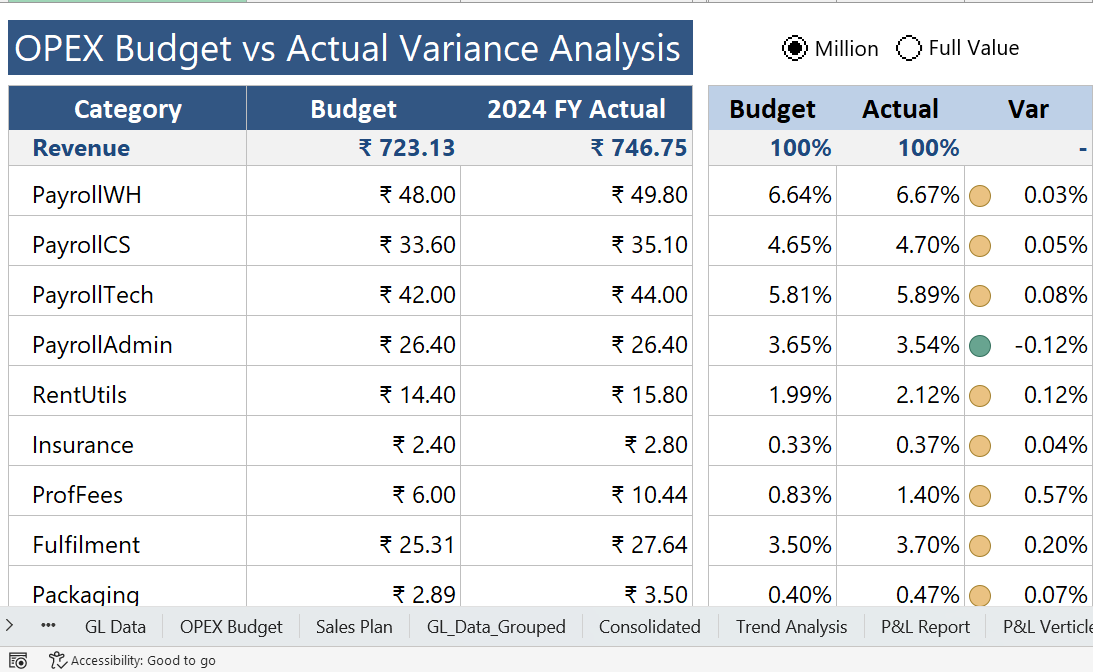
Budget vs Actual IT Project Financial Analysis
MIS Reporting
MIS Reporting Introduction
MIS Reporting — Why to use Functions for MIS Reporting
Problem #1 — Create a summary showing location wise count
Problem #2 — Create a summary showing Premium vs Standard count
Problem #3 — Populate Employee count by Location & Status
Problem #4 — Populate Employee Count & Average Cost rate
Problem #5 — Calculate subtotal of employee cost rate
Problem #6 — FILTER & Average to calculate Grand total Average
Problem #7 — Travel Budget vs Actual Reporting Requirements
Problem #8 — Requirement analysis to report structure
Problem #9 — Populate the Travel budget & actual numbers
Problem #10 — How to install Power Query
Problem #11 — Designing & validation of Report
Problem #12 — Report 2 — Requirement Analysis
Problem #13 — Understanding KPIs & Calculations
Problem #14 — How to do your data study
Problem #15 — How do you structure your report
Problem #16 — Extract source data into calculation file
Problem #17 — Clean & Transform Budget Revenue
Problem #18 — Clean & Transform Revenue Actuals
Problem #19 — Clean & Transform Labour Plan Data
Problem #20 — Clean & Transform Labour Actual
Problem #21 — Clean & Transform Travel Plan
Problem #22 — Clean & Transform Travel Actuals
Problem #23 — Clean & Transform Other Expenses Plan
Problem #24 — Clean & Transform Other Exp Actuals
Problem #25 — Populating the numbers with SUMIFs
Problem #26 — Complete Remaining calculations
Problem #27 — Calculating QTD and YTD Numbers
Problem #28 — Enabling ALL FILTER for Project ID
Problem #29 — Formatting the Report
Problem #30 — Final Validation
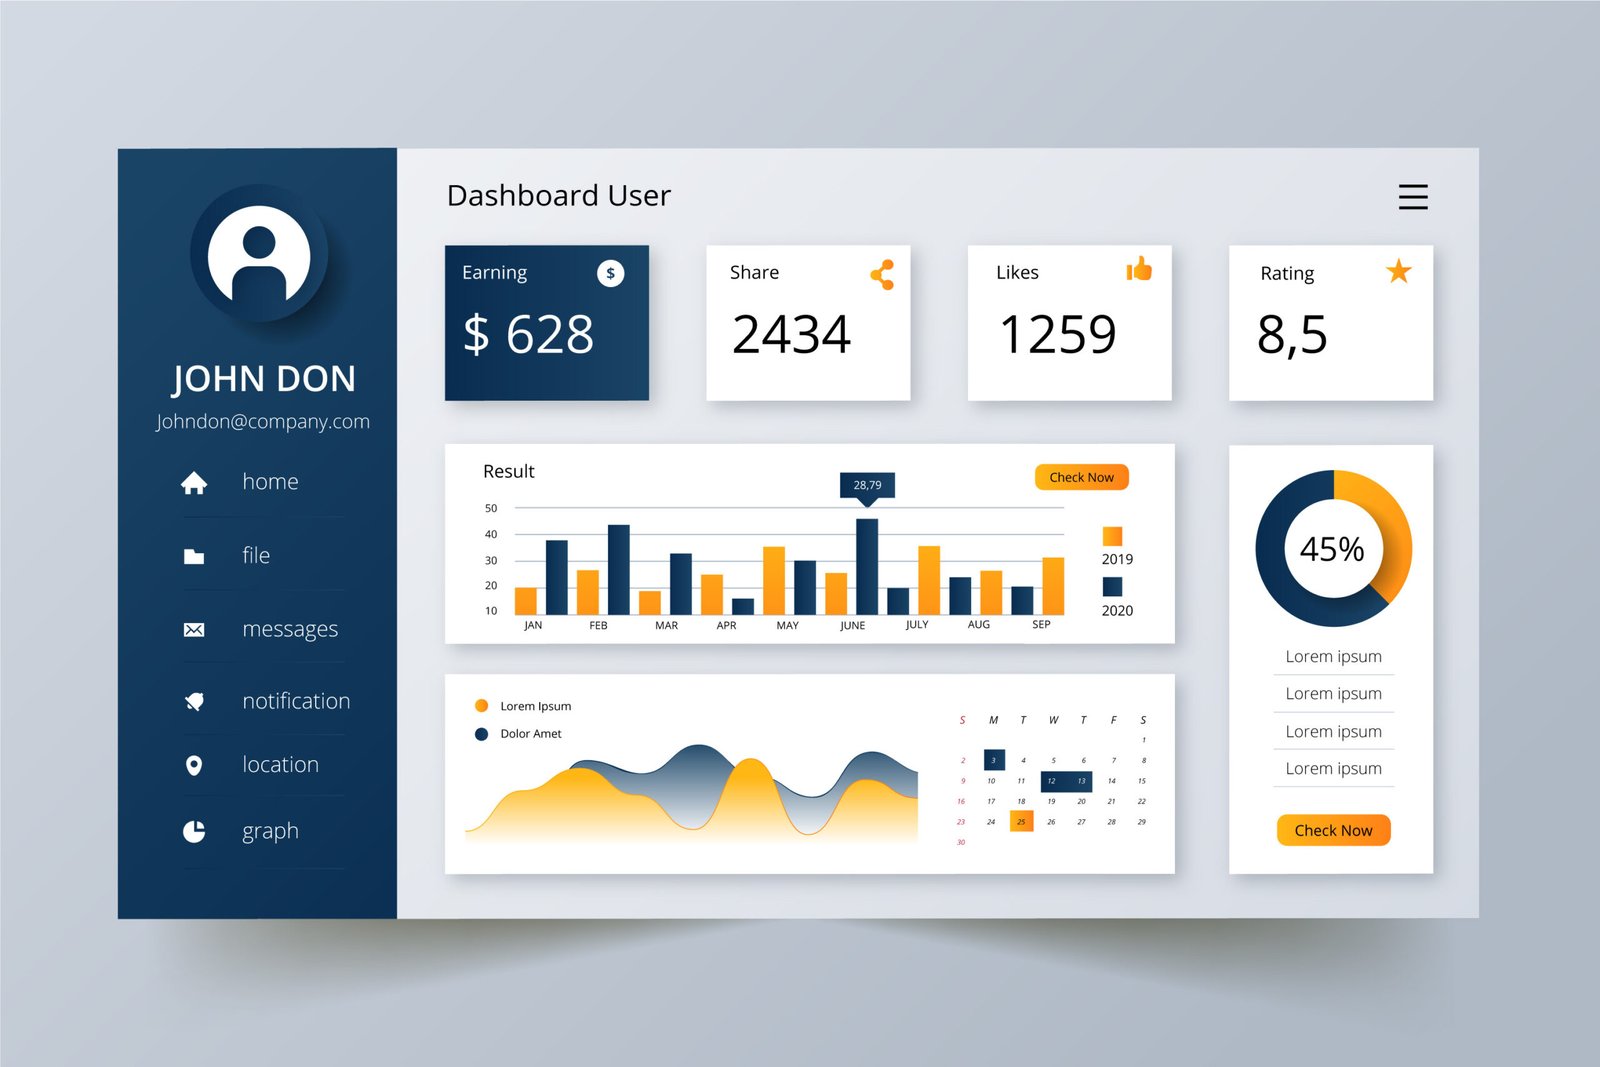
Headcount Status Dashboard
Dashboard Introduction
Two different approaches to Dashboard Building
Dashboard Creation Process
Dashboard Creation — Client Requirements
Problem #1 — Analyze Client requirements
Problem #2 — What is a wireframe and why to create it
Problem #3 — How to create Pivot Table summaries
Problem #4 — How & why to create a story board
Problem #5 — Create your Charts
Problem #6 — Which chart to choose when
Problem 7 — Format the chart elements
Problem 8 — Arrange Charts in Dashboard Layout
Problem 9 — Making the alignments right
Problem #10 — Create KPI Cards
Problem #11 — How to format your first chart
Problem #12 — How to use Templates
Problem #14 — Format KPI Visuals
Problem #15 — Create a Project Lead Slicer
Problem #16 — Final Changes
Course Wrap up
Setup & Project Files
Before you Start
Guidelines
Project Files
Project Files v.01
Excel Dynamic Dashboard
1. Requirement Analysis
2. Study Data & KPI Calculations
3. Prepare Employee Data
4. Prepare Travel Data
5. Create Calculation Sheet Part 1
6. Calculation Sheet Employee Data Part 2
7. Calculation Sheet Travel Part 1
8. Calculate Forecast Figures
9. Calculation Sheet Travel Continued
10. Creating Charts
11. Finalizing Headcount Dashboard
12. Finalizing Travel Dashboard
13. Finalizing Travel Dashboard Part B
14. Setting up Access Control
15. Setting up Access Control Part B
Income Statement & Analysis
1. Dataset Introduction
2. Prepare Calculation Sheet
3. Creating a new Amount column
4. Structuring Income Statement
5. Formatting Income Statement
6. Income Statement Vertical Analysis
7. Formatting Vertical Analysis
8. Income Statement Horizontal Analysis
9. Vertical Analysis Conditional Formatting
10. Trend Analysis
11. Trend Analysis Formatting
12. Operating Expense Budget vs Actual Analysis Part A
13. Operating Expense Budget vs Actual — Formatting
Forecasting & Scenario Planning
14. Excel Forecasting Function Part A
Excel Forecasting Function Part B
Best case / Worst case / Base case Scenario Template
Forecasting Basecase Scenarios — Part 1
Forecasting Basecase Scenarios — Part B
Forecasting Basecase Scenarios — Part 3
Forecasting Basecase Scenarios — Part 4
Forecasting Basecase Scenarios — Part 5
Goal Seek
Data Table
Solver
Course Wrap up
Introduction
1. Session Introduction
2. How this learning is organized
3. Excel BI Framework
Instructions (Important)
Project Data Files (Download)
Project Files
Get Data
4. Getting Data into Excel
5. Extracting first data file into Excel
6. Load Data & save
Power Query — Import & UI
7. Power Query UI Overview — 1
8. Power Query UI Overview — 2
9. Power Query UI Overview — 3
10. Power Query UI Overview — 4
11. Power Query UI Overview — 5
12. Power Query UI Overview — 6
13. Power Query Applied Steps
14. Power Query Import Project Data
15. Import Sales data from folder
Power Query — Transformation
16. Project Data Transformation — 1
17. Project Data Transformation — 2
18. Project Data Transformation — 3
19. Project Data Transformation — 4
20. Project Data Transformation — 5
21. Project Data Transformation — 6
22. Project Data Transformation — 7
23. Project Data Transformation — 8
24. Project Data Transformation — 9
25. Project Data Transformation — 10
26. Project Data Transformation — 11
27. Data Transformation — Merge Queries
28. Data Transformation — Group Data
29. Data Transformation — Append
Data Modelling
30. Data Modelling Introduction
31. Data Modelling — Fact & Dimension Tables
32. Data Modelling — Primary & Foreign Keys
33. Data Modelling — Connecting Tables
34. DAX & Reporting — Introduction
DAX & Financial Reporting
35. DAX & Reporting — Creating a Measure
36. DAX & Reporting — Aggregation Measures
37. DAX & Reporting — Aggregation Functions Part B
38. DAX & Reporting — Text, Date Functions
39. DAX & Reporting — The Filter Context
40. DAX & Reporting — GST Calculation with Iterative function
41. DAX & Reporting — Iterative function measure
42. DAX & Reporting — Forecast model with Iterative Function
43. DAX & Reporting — Forecast best & base case scenarios
44. DAX & Reporting — Creating a disconnected table
45. DAX & Reporting — Dynamic Toggle Button
46. DAX & Reporting — Handling Default State in measure
47. DAX & Reporting — Using SWITCH for Scenarios
48. DAX & Reporting — Dynamic Forecast with HASONEVALUE
49. DAX & Reporting — Changing Filter Context with Calculate
50. DAX & Reporting — Calculate with multiple filters
51. DAX & Reporting — Sales Trend Analysis against Q4 '23
52. DAX & Reporting — Sales Trend Analysis Avg Part B
53. DAX & Reporting — Formatting Sales Trend Analysis
54. DAX & Reporting — Opex Spend Analysis Part A
55. DAX & Reporting — Opex Budget vs Actual Analysis — Part B
56. DAX & Reporting — Opex Variance Analysis Part C
57. DAX & Reporting — P&L Reporting Automation — Part A
58. DAX & Reporting — CoA, P&L KPIs, Opening Stock
59. DAX & Reporting — EBITDA, Net Margin Calculation
60. DAX & Reporting — Formatting P&L Report
61. DAX & Reporting — Analyzing Revenue Drop — PVM Analysis
62. DAX & Reporting — Price Volume Impact Analysis — Part B
63. DAX & Reporting — Formatting PVM Analysis
64. DAX & Reporting — Analyzing EBITDA Drop
65. DAX & Reporting — Opex BvM Analysis
66. DAX & Reporting — Opex Spend Ratio Analysis
67. DAX & Reporting — Opex Category Ratio Analysis
68. DAX & Reporting — Opex to Revenue Analysis
69. DAX & Reporting — Opex Monthly Budget vs Actual %
70. DAX & Reporting — Opex Spend Deep dive
71. DAX & Reporting — Formatting Opex Analysis
72. DAX & Reporting — Change number formats
73. DAX & Reporting — Opex Reporting Formatting Continued
74. DAX & Reporting — Revenue Mix Analysis
75. DAX & Reporting — Revenue Mix Analysis Formatting
76. DAX & Reporting — Revenue Mix Percentage performance
77. DAX & Reporting — Addressing Challenges with ALL Filter
78. DAX & Reporting — Analyzing Product Sales Drop
79. DAX & Reporting — Analyzing YTD Budget vs Actual
80. DAX & Reporting — Year over Year Analysis

Project Portfolio

Real dashboards. Real finance data. Built for MNC roles.

These are the exact reports and dashboards you will build during the program.

Budget vs Actual Variance
MIS Reporting Automation
Financial Analysis Dashboard
Power Query Data Modelling
FP&A Reporting Automation
LIMITED TIME OFFER

Join Today at ₹999.
After July 10, This Offer Is Gone.

Lock in founder pricing today. Price increases to ₹1,499 after July 10.

⏳ Offer Closing Soon

1,500+ Finance Professionals already joined at ₹999.

Everything You Get Today
5-Level Excel Program₹4,999
Power BI Bonus Course₹1,999
LinkedIn Bonus₹999
Doubt Support₹999

Total Value ₹9,000+
Today Only ₹999

Enroll Now vs Enroll Later

Enroll Now
Enroll Later
Price
₹999
₹1499
Bonus
Power BI Included
Removed
Access
Lifetime
1 Year Only
Self-Paced
₹1499
₹999

✔ All 5 Levels

✔ Power BI Bonus Course

✔ LinkedIn Bonus

✔ Lifetime Access

Enroll Now
Premium
₹3999
₹2499

✔ Everything in Self-Paced

✔ 10-Day Live Training

✔ Daily Q&A

✔ Lifetime Access

Get Premium
🛡️ 7-Day Full Refund Guarantee — Zero Risk
REAL TRANSFORMATION

Highly Appreciated by Finance & Accounting Professionals
A Career Accelerator for Finance Professionals.

For the practical skills, automation mindset and career value it creates.

Included with every enrollment

Two bonus courses — free with your program

Skills that help you learn faster, grow your career and get noticed by the right people.

Power BI Sales Analytics
Bonus 01 Included Free

Power BI for Sales Analytics

Get your first look at Power BI — the tool used by MNC teams to build dashboards. This introductory course teaches you how to analyse sales data and build interactive reports.

  • Build your first Power BI sales dashboard from scratch
  • Analyse sales trends, targets and performance visually
  • Understand how Power BI connects to your Excel skills
LinkedIn for Job Seekers
Bonus 02 Included Free

LinkedIn for Finance Job Seekers

Having the right skills is only half the job. This course teaches you how to set up your LinkedIn so recruiters find you — and what to do when they do.

  • Set up your LinkedIn profile to stand out to Finance recruiters
  • Search for jobs, set alerts and never miss the right opportunity
  • Simple tactics to get noticed and get responses from hiring managers
Both bonus courses are 100% Free — included with every plan No extra payment. No coupon needed. Just enroll and you get everything.

Student Success Stories

Real people. Real results. Real careers.

1,500+ finance and accounting professionals trained across India.

★★★★★
Verified Placement

"From BSc + CMA to Finance Professional at Deloitte"

BSc · CMA Student Finance Analyst, Deloitte
Thrishna feedback
★★★★★

"I used it at work the very next day"

"The step-by-step approach to MIS automation using real MNC datasets is exactly what I was looking for. I was able to use these techniques in my actual job right away."

S
Sachin
Finance Professional · MNC
★★★★★

"My reporting and analysis improved immediately"

Mazhar feedback
★★★★★

"One of the best Excel trainers I have come across"

Ajith feedback
★★★★★

"My work improved and people started noticing"

Student feedback
★★★★★
Career Transition

"Restarted my career and moved into an MNC role"

Ramshi feedback
1,500+
Professionals Trained
Deloitte
Where Students Got Placed
IBM · EXL
And More MNCs
Sobhish — Founder SOBH's Analytics
Sobhish
Founder · SOBH's Analytics · Ex-IBM Finance Manager
🏆 Silver Stevie Award — IBM
🏆 Golden Globee Award — IBM
📊 1,500+ Professionals Trained
Your mentor Not a trainer
Someone who did the job for 19 years.
Before building this program, Sobhish spent 19 years at IBM and Genpact — actually doing FP&A, MIS reporting and Finance analysis at MNC level.
19+ years at IBM and Genpact — not as a trainer. As a Finance Manager actually doing the work every day.
Built the exact reports this program teaches — MIS, variance analysis, CFO dashboards, budget vs actual reporting.
Won the Silver Stevie Award and Golden Globee Award at IBM — for excellence in Finance and Operations.
Trained 1,500+ finance professionals across India — freshers, accountants, MIS executives and Finance Managers.
Every lesson comes from real MNC experience — not copied from YouTube or other generic Excel courses.

I have been in the same position — working on reports, fixing errors, and struggling with time. This program is built to help you move beyond that.

View LinkedIn Profile →

What happens after you enrol

Three simple steps to get started today

1
Pay Securely via Razorpay
UPI, card, or net banking — takes under 60 seconds. You get an instant confirmation on screen and by SMS.
Under 60 seconds
2
Get Your Access on WhatsApp
Your login link and WhatsApp community access are sent directly to your phone within 30 minutes — no email hunting needed.
Within 30 minutes
3
Start Learning Today
Access all 5 levels of content the same day. Your bi-weekly doubt clearing sessions begin from your first week.
Start immediately

Ready to get started?

Enroll Now — ₹999 →

🔒 Secure payment via Razorpay  ·  Questions? WhatsApp +91 62825 57744

Every week you wait is another week of
the same routine reports and problems.

Get access to the most practical Excel course at just ₹999 — before the price goes up on July 10.

🛡️ 7-day full refund  ·  🔒 Secure payment via Razorpay  ·  Price goes to ₹1,499 on July 10
Before You Enroll

Common questions, honest answers.

Definitely. You do not need a finance background to join. The program starts from Excel basics in Level 1 and builds up step by step. If you are in operations, HR, project management, or any role that uses data — you will be able to follow along and benefit from the automation and reporting skills.
If you can use a computer and work with numbers in any way — you are ready. Many students had no finance background when they started and now work in FP&A roles at MNCs.
Both plans give you access to the full 5-level program. The difference is the 10-day live training:
₹999
Self-Paced Access — All 5 levels, Power BI module, LinkedIn course, bi-weekly doubt clearing sessions. 1 year access validity.
₹2,499
Live with Sobhish — Everything in ₹999, plus 10 days of live dashboard automation sessions with Sobhish. Daily practice, Q&A, recordings provided. Lifetime access validity.
If you want to learn faster with live guidance and have a real project to show in 10 days — go with ₹2,499. If you prefer to learn at your own pace — ₹999 is a great start.
It depends on the plan you choose:

₹999 Self-Paced — 1 year access from the date of enrollment.
₹2,499 Live with Sobhish — Lifetime access. You keep everything forever, including all future updates.
Both plans include access to all future content updates added to the program at no extra cost.
Once you complete the payment, you will receive your login link and access details on WhatsApp within 30 minutes. No waiting, no email hunting. You can start learning the same day.
Make sure your WhatsApp number is active and reachable — that is where we send your access.
Two ways to get your questions answered:

1. Student Query Form — Submit any doubt inside the course portal. Sobhish reviews and responds personally.

2. Bi-Weekly Live Sessions — Join the live doubt-clearing sessions held every two weeks. Ask questions directly and get them resolved in real time with Sobhish.
You can watch the course videos on any device — mobile, tablet, or laptop. However, for the practical exercises:
Windows PC is required for automation. Normal Excel works on both Mac and Windows — but Power Query, Power Pivot, and DAX automation features only work on Windows. If you are on a Mac, you can still watch and learn, but you will need a Windows computer for hands-on practice.
No. All you need is Microsoft Excel — which most Windows computers already have. All practice datasets are provided inside the course portal. You do not need to purchase any external tools, plugins, or data sources.
Very different. YouTube tutorials teach individual functions in isolation. This program teaches you how finance teams at MNCs actually work — using real Finance data to build complete MIS reports, variance dashboards, and automated CFO packs from scratch.

Sobhish spent 19 years at IBM and Genpact doing exactly this work. Every session is built from that real experience — not copied from other courses or YouTube content.
The difference is simple — YouTube teaches you functions. This program teaches you to think and work like a Finance Analyst. At the end, you will have real projects to show in interviews — not just a certificate.
It will significantly improve your chances. Students who completed this program have moved into roles at Deloitte, EXL, IBM and other MNCs. The reason is simple — you graduate with actual finance projects built on real data, not just a certificate.

When an interviewer asks "show me what you have built" — you will have something to show.
We cannot promise a job. But we can promise you will walk into every interview with something real to show — and that changes everything.
We offer a 7-day full refund — no questions asked. If you feel the program is not the right fit within the first week, email us at hellosobhs@gmail.com and we will process your refund through Razorpay immediately. No conditions, no delays.
Yes. Once you complete this program, you can join our Advanced Financial Analytics Program (AFAP) — a 2-month live program covering Power BI, AI for Finance, variance analysis, DSO, DPO, Cash Conversion Cycle, and building senior-level finance dashboards.

The approximate investment for AFAP is ₹15,000. Students from this program get priority access and referral credits.
The best time to start was a year ago. The second best time is today.
If you are reading this, you already know you need it.
The only question is whether you act on it.
Enrol Today — Questions? +91 6282557744
Enrol Now ₹999